Testing your installation
Using the EX-Installer Device Monitor
Once you have selected a device in EX‑Installer on the “Select your device” screen, or after successfully loading software onto your device, a View device monitor button will be available.
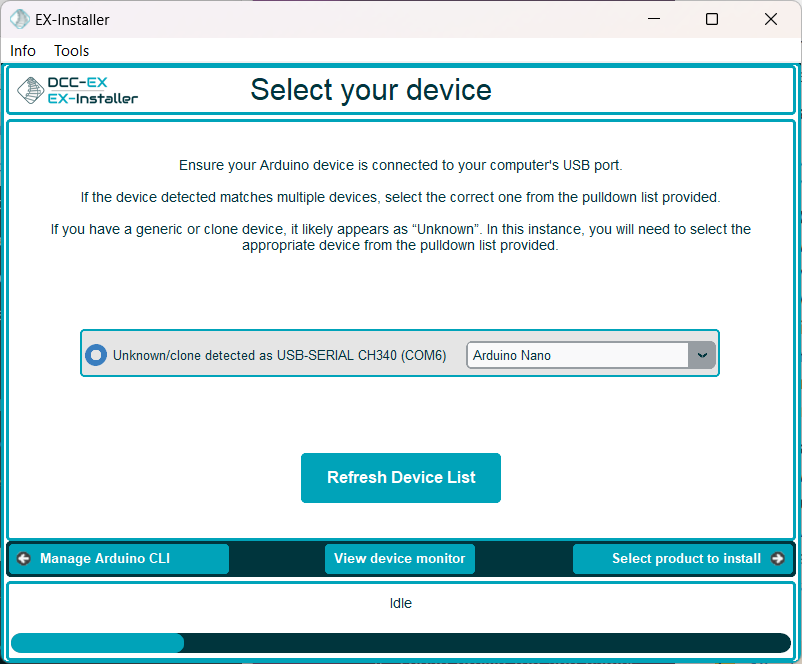
Fig 335: Select your device screen
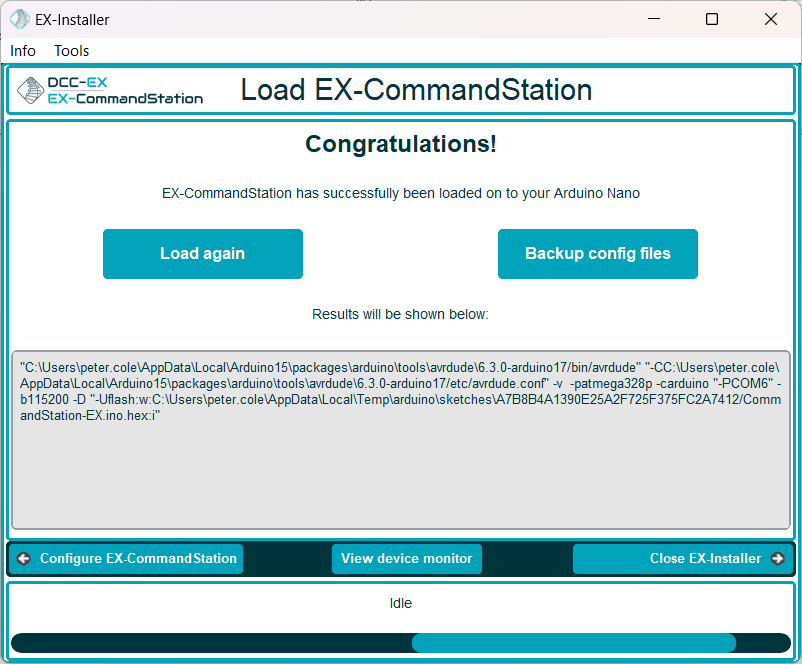
Fig 336: Load software screen
When clicking this button, the EX-Installer Device Monitor window will open, allowing you to interact with your device by sending commands and viewing the serial console output.
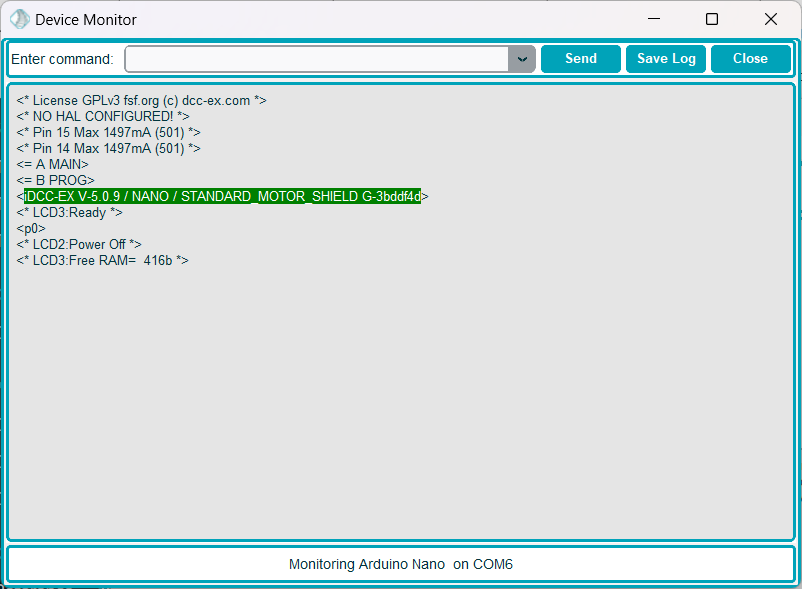
Fig 337: Device Monitor
Within the EX-Installer Device Monitor window, you will see the serial console output of your device. As you can see in this screen shot, certain key bits of information are highlighted to help identify these when asked by the DCC-EX team.
The following information is highlighted for EX‑CommandStation:
EX‑CommandStation version information (green)
WiFi firmware version (green)
WiFi SSID and password in access point mode (blue)
WiFi SSID in station (STA) mode (blue)
WiFi IP address and port (purple)
Sending commands
You can send any supported command to your device by typing it into the “Enter command” box and clicking the “Send” button. Refer to the DCC-EX Native Commands Summary Reference for the list of available commands. This will also work for the EX‑Turntable EX-Turntable interactive serial console commands and EX‑IOExpander EX-IOExpander commands.
Saving startup or serial console logs
When interacting with the DCC-EX team for support, you will likely be asked to provide the “startup logs”, or output from the serial console of your device.
Using EX-Installer Device Monitor is the simplest way to obtain this information by using the Save log button.

Fig 338: Save device log screen
Using this option, you can browse to a location on your computer you can easily find (such as your Desktop), allowing you to upload this to Discord or a GitHub issue and share with the team.
When clicking the Save and open log button, it will save the file, but also open it on your screen. This way, if you’re unable to upload the file for some reason, you can copy and paste the text instead.
Using the Arduino IDE Serial Monitor
This page is a brief introduction to using the Arduino IDE Serial Monitor. For additional information see the Using a Serial Monitor page.
To test with the Arduino IDE Serial Monitor, download the Arduino IDE from the following link and install it on your computer.
To do a quick test, open the Arduino application:
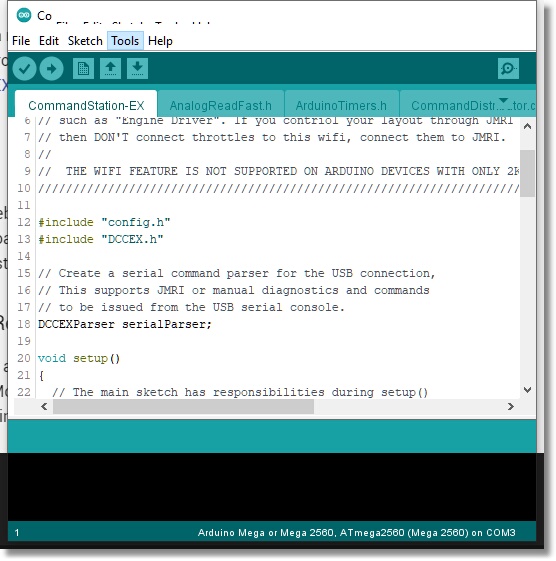
Fig 339: The Arduino IDE
Select “Tools -> Serial Monitor” from the Arduino IDE menu
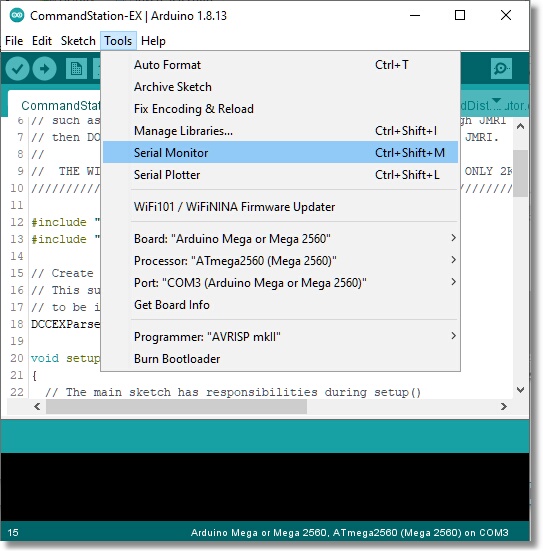
Fig 340: Open the Serial Monitor from the Tools Menu
You will see the following screen:
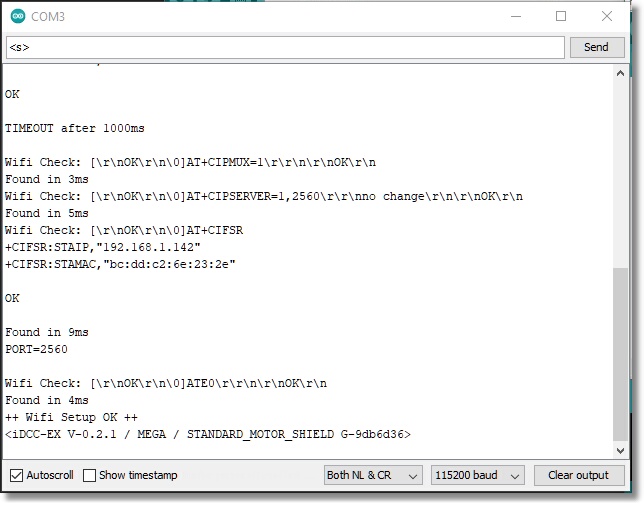
Fig 341: Serial Monitor
Select “115200” as the baud rate in the dropdown in the lower right
Select “Both NL & CR” from the dropdown next to the baud rate
When you open the Arduino IDE Serial Monitor you will see at least one line sent out as status information. If you have a WiFi board or Ethernet Shield you will see a page full of log information as it configures and connects to your network.
At the top of the Arduino IDE Serial Monitor type <s> (lowercase “s”) into the command textbox and press “Send”. You should see:
<iDCC-EX V-0.2.1 / MEGA / STANDARD_MOTOR_SHIELD G-9db6d36>
This is the “status” command and reports your version, types of boards you are using, and a build number.
There are a lot of other commands you can enter here. As a matter of fact, you could use the Arduino IDE Serial Monitor to test any of the DCC-EX API (application programming interface) commands. Please see the DCC-EX Wiki for a list of commands or for additional information on using the Arduino IDE Serial Monitor see the Using a Serial Monitor page.
Using EX-WebThrottle
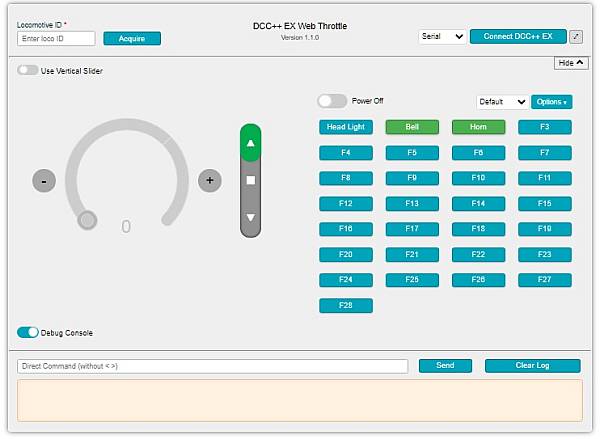
Fig 342: EX-WebThrottle
Click this link: EX-WebThrottle to run EX-WebThrottle hosted on our site, or visit GitHub to get the latest version to run on your computer.
Using Engine Driver (or other WiThrottle Protocol Throttle) - Requires WiFi
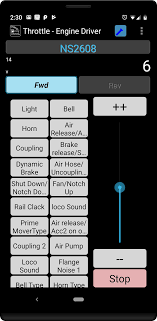
Fig 343: Engine Driver
You will need to install Engine Driver on your mobile device and then connect to the Command Station, either directly with AP mode or through your router with Station Mode. You can then use your phone to control your trains.


